> For the complete documentation index, see [llms.txt](https://docs.console.zenlayer.com/welcome/llms.txt). Markdown versions of documentation pages are available by appending `.md` to page URLs; this page is available as [Markdown](https://docs.console.zenlayer.com/welcome/ai-gateway/ai-gateway-usage-analytics.md).
# AI Gateway Usage Analytics
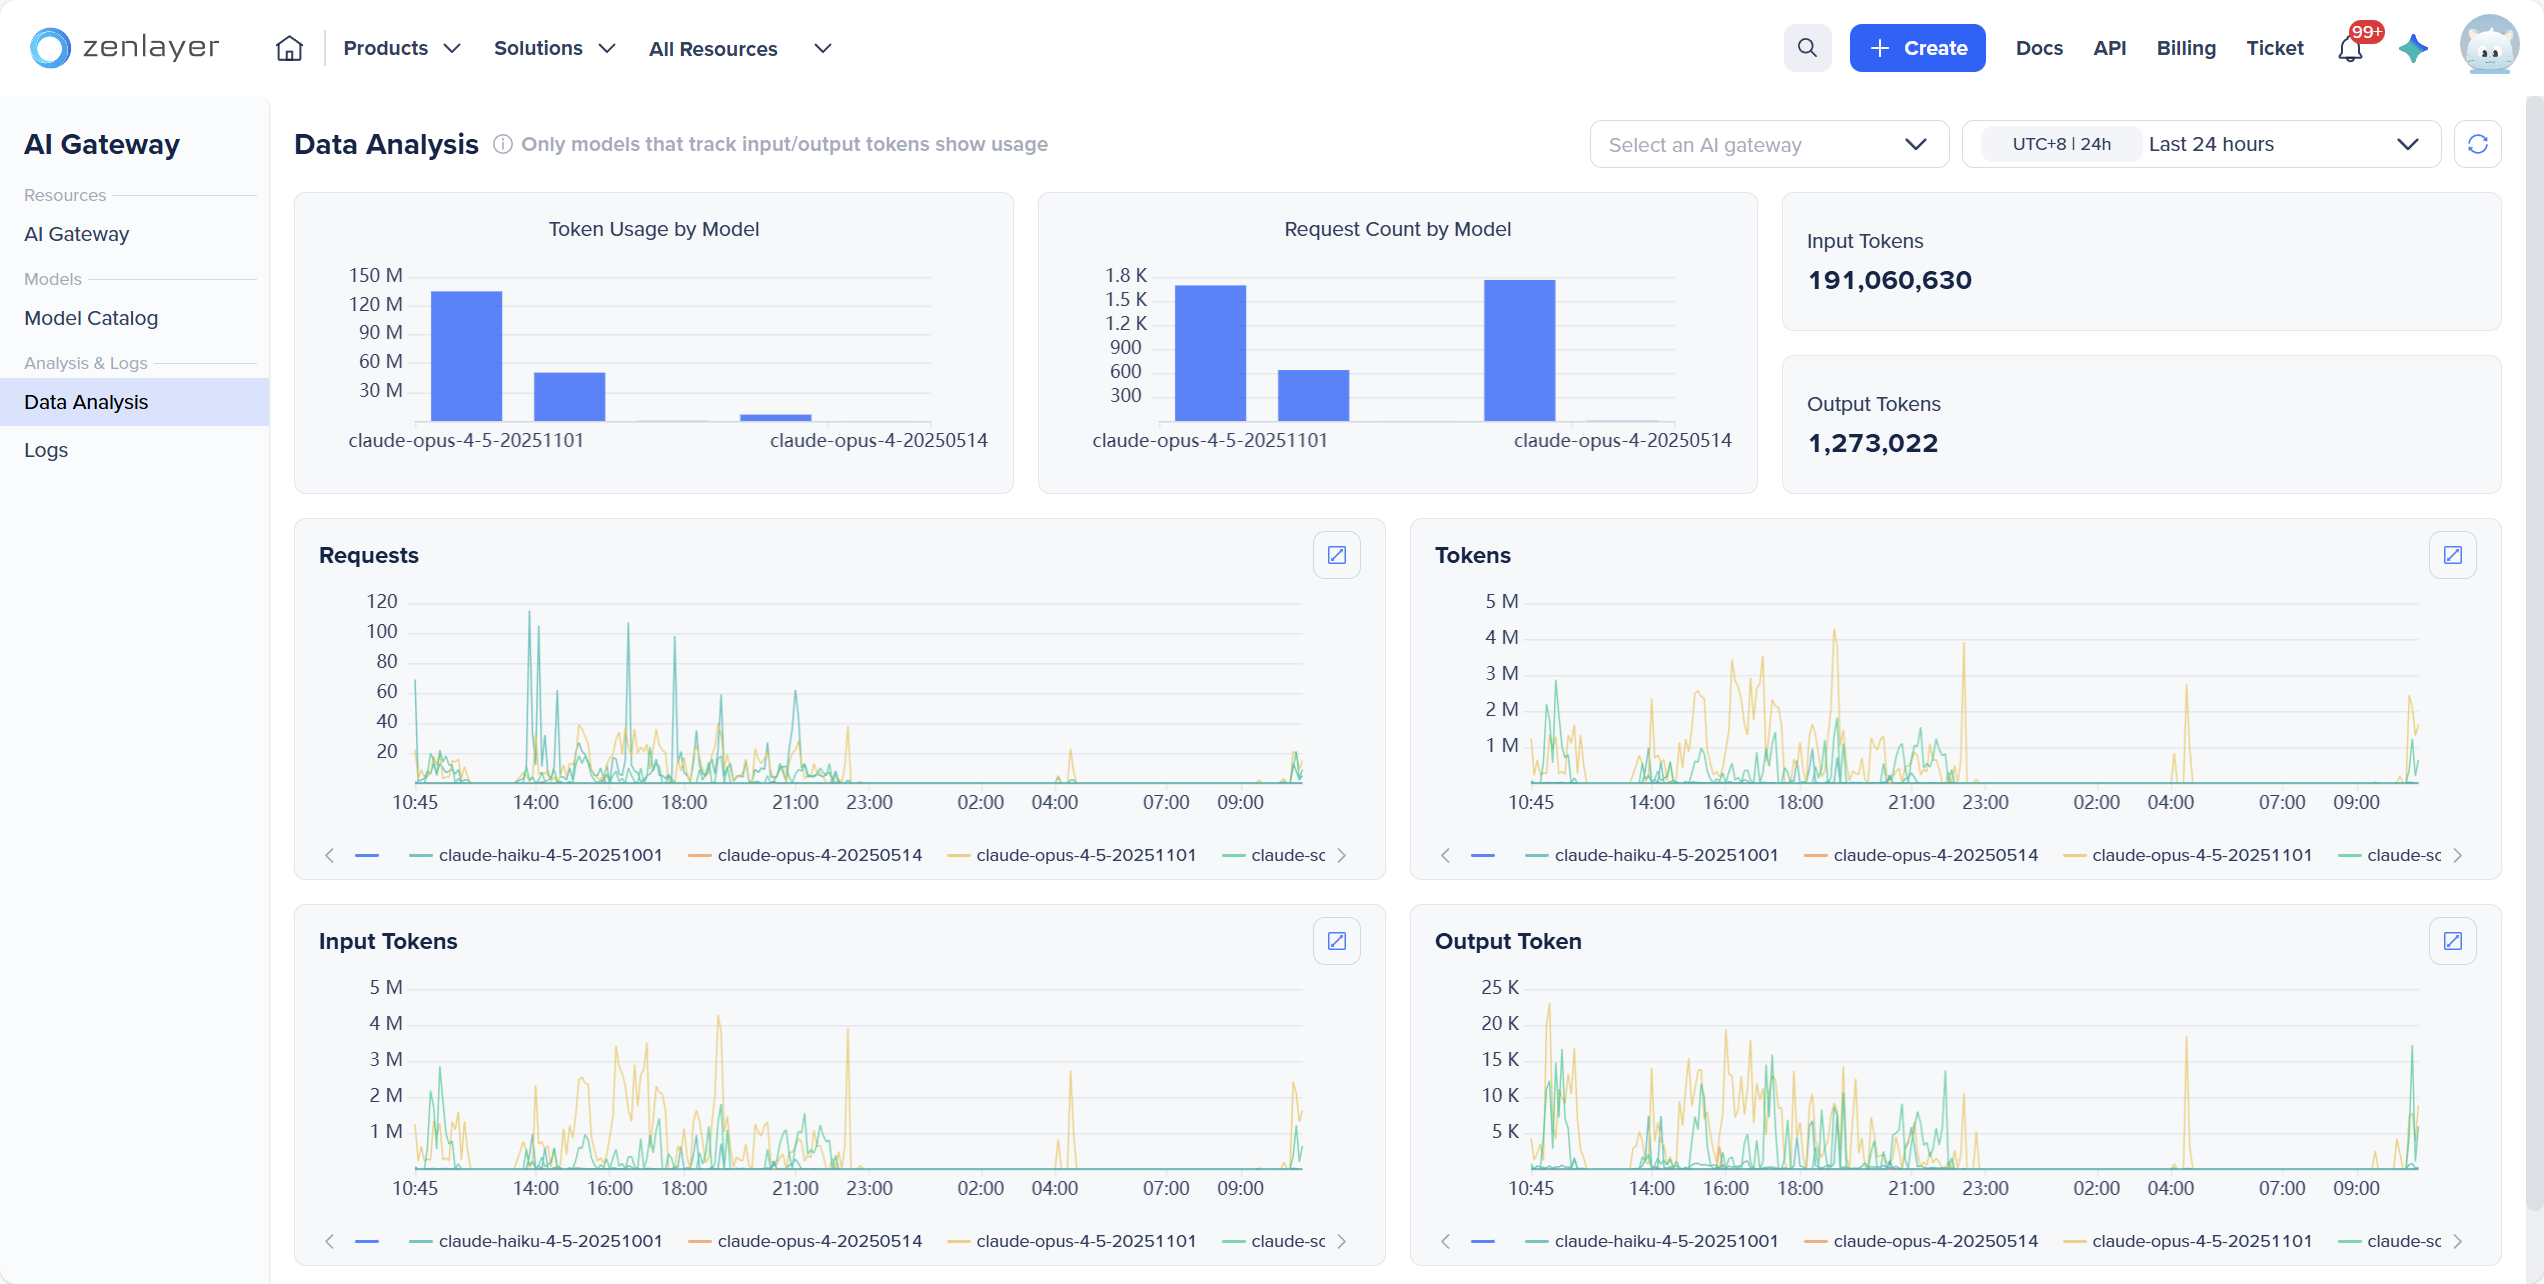
Usage Analytics provides visibility into how your AI Gateway is being used, helping you understand consumption patterns, model adoption, and overall usage trends.
### Available Metrics
The following metrics are available to help you analyze usage at the model level:
* **Token usage by model**\
Displays the total number of tokens consumed by each model over the selected time range.
* **Request count by model**\
Shows how many API requests were sent to each model, helping identify traffic distribution.
* **Input tokens**\
Represents tokens consumed by request inputs, useful for understanding prompt size and request complexity.
* **Output tokens**\
Represents tokens generated by model responses, useful for evaluating response length and cost impact.
You can select specified AI gateway and filter data by time range (e.g., last 6 hours or custom intervals).
{% hint style="info" %} **Note**
* Only models that report input and output token usage are included in analytics.
* Usage data may be delayed by several minutes and may not appear in real time.
{% endhint %}